Dashboard and Reporting
Sales
The Sales Dashboard provides a high-level summary of key metrics and insights into your business's sales performance. The main components of the dashboard include:
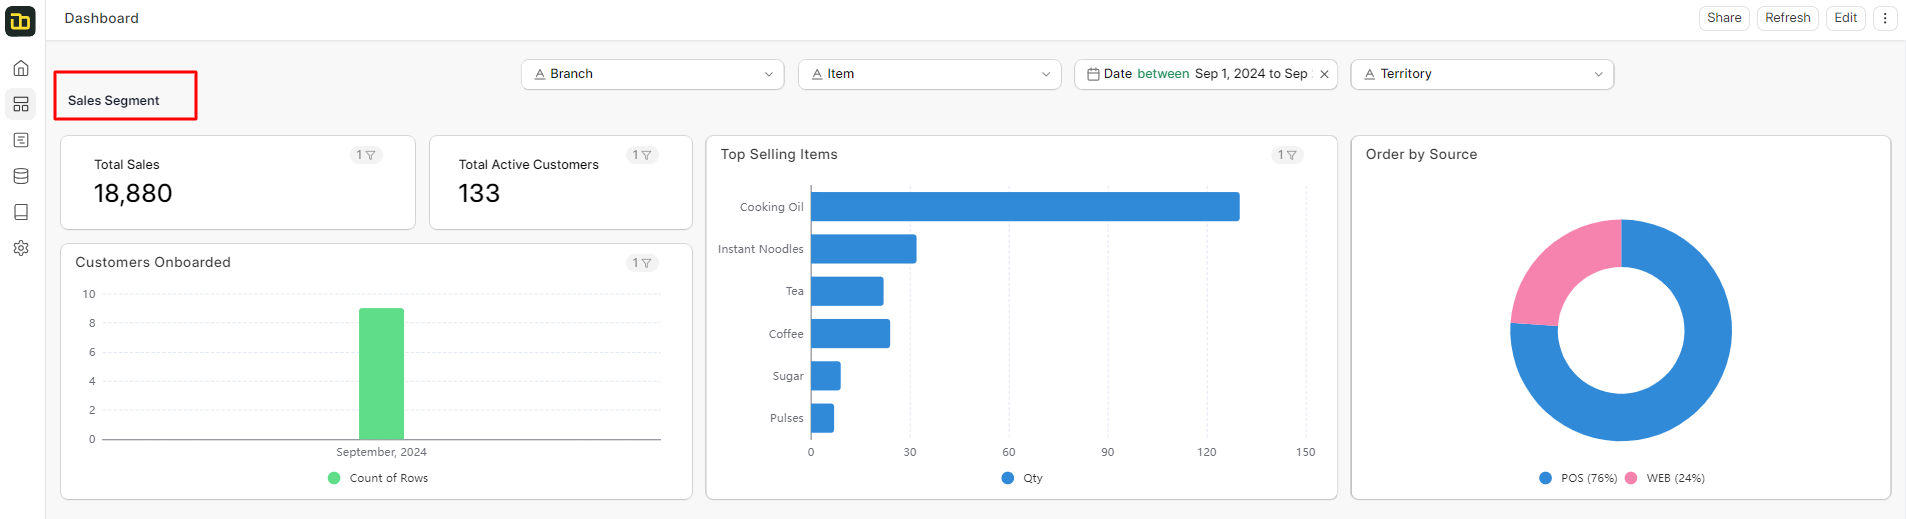
1. Total Sales
This metric shows the total number of sales recorded during the selected time period, helping track overall sales performance and providing a quick summary of the total revenue generated.
2. Total Active Customers
This metric displays the number of unique customers who made purchases in the selected time frame, helping identify customer engagement and track retention by showing how many customers were actively buying.
3. Customers Onboarded
This bar chart shows the number of customers who have been onboarded during the selected period, tracking new customer acquisition and providing insights into customer base growth.
4. Top Selling Items
This bar chart displays the most sold items in descending order based on quantity, allowing businesses to identify best-selling products and gain insight into consumer preferences for optimized inventory and marketing strategies.
5. Order by Source
This pie chart shows the distribution of sales across different sources (e.g., POS and Web), providing insights into which sales channels are performing best and guiding decisions on marketing focus and operational improvements.
6. Filters
Branch Filter: View sales data by specific branch locations.
Item Filter: Filter sales data based on selected items.
Date Range Filter: Analyze data for a specific period.
Territory Filter: Break down sales data by geographic territories.
These filters allow users to customize the dashboard view for more focused analysis of sales data based on various parameters such as branch, item, date, or territory.
Purchase
The Purchase Dashboard offers insights into your purchasing activities and supplier relationships, helping you track purchase performance and manage suppliers effectively. The main components of the dashboard include:
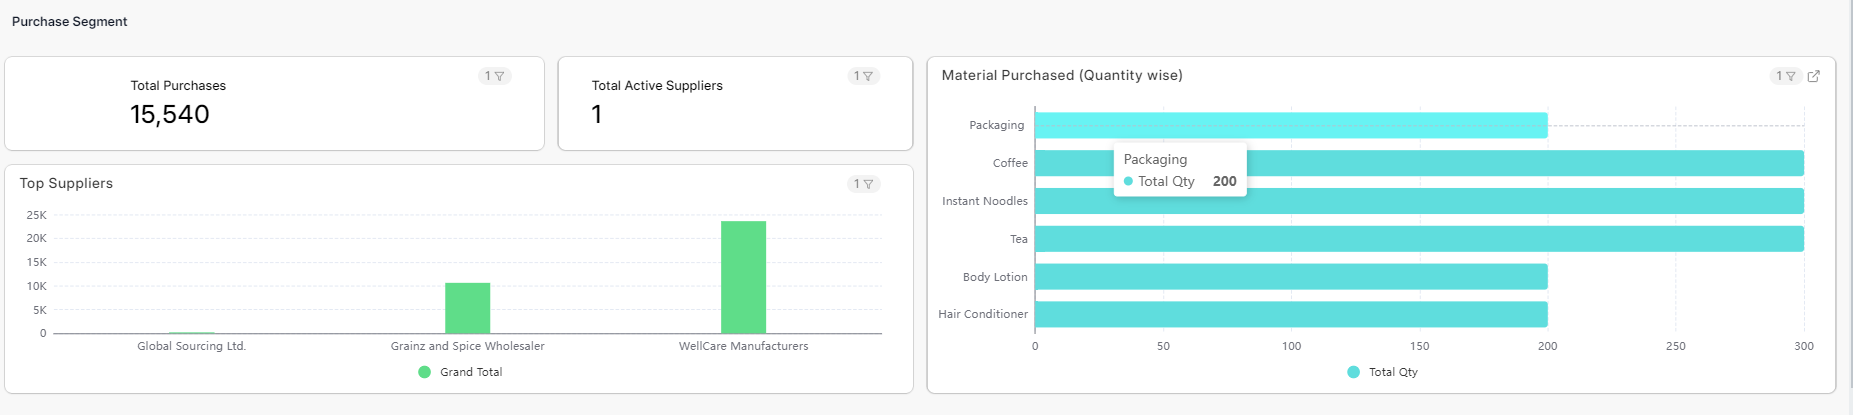
1. Total Purchases
This metric displays the total amount of purchases made during the selected time period, providing a quick overview of the total expenditure and helping to monitor purchase trends over time.
2. Total Active Suppliers
This metric shows the number of suppliers actively providing goods or services during the selected time period, allowing you to track supplier engagement and understand the diversity of your supply chain.
3. Top Suppliers
This bar chart displays the top suppliers based on the total purchase value from each supplier, helping you identify key suppliers contributing the most to your purchasing activities. It allows businesses to analyze supplier performance and ensure continuity of supply.
4. Material Purchased (Quantity wise)
This bar chart provides a breakdown of the quantity of materials purchased, sorted by item type, helping businesses monitor inventory levels and procurement patterns. It provides insights into which materials are being sourced in the highest quantities, aiding in supply chain and stock management decisions.
Warehouse
The Warehouse Dashboard provides insights into the current stock levels across different branches, helping businesses manage inventory effectively and ensure stock availability at all locations. The main component of this dashboard includes:
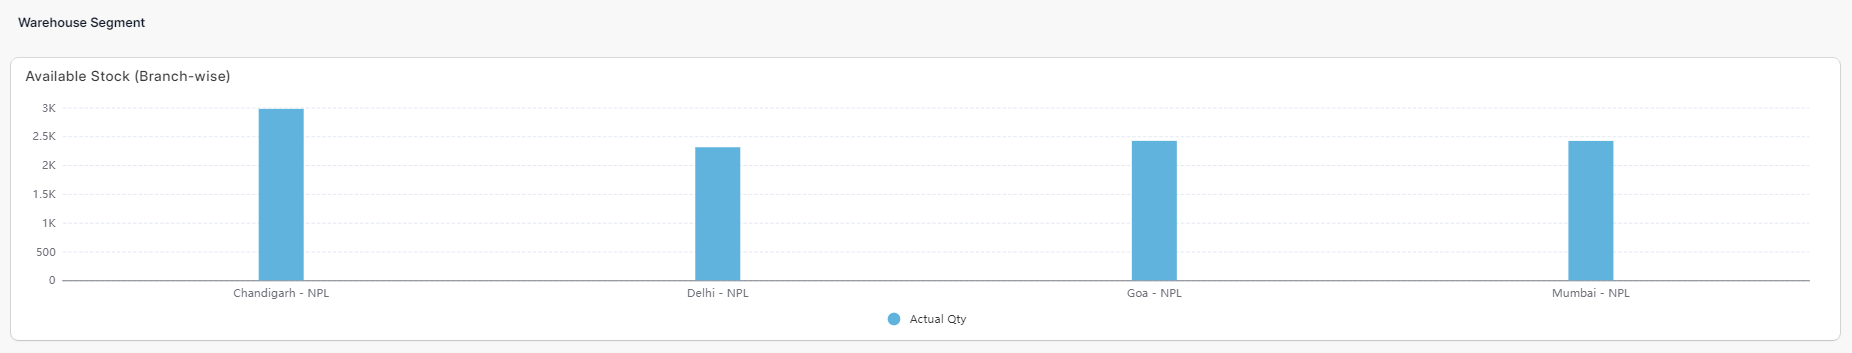
1. Available Stock (Branch-wise)
This bar chart displays the actual quantity of available stock across different branches, helping businesses monitor inventory levels at specific locations. It provides a clear view of how stock is distributed, allowing for better decision-making in terms of stock transfers, procurement planning, and fulfillment efficiency.
Branches Shown:
Chandigarh - NPL
Delhi - NPL
Goa - NPL
Mumbai - NPL
The chart allows businesses to assess stock sufficiency in each branch, ensuring that no branch is under or overstocked, improving overall warehouse management and operational efficiency.
Accounting
The Accounts Dashboard offers a comprehensive view of your business’s financial performance, tracking income, expenses, and payments. It helps users manage cash flow and monitor financial health effectively. The main components of this dashboard include:
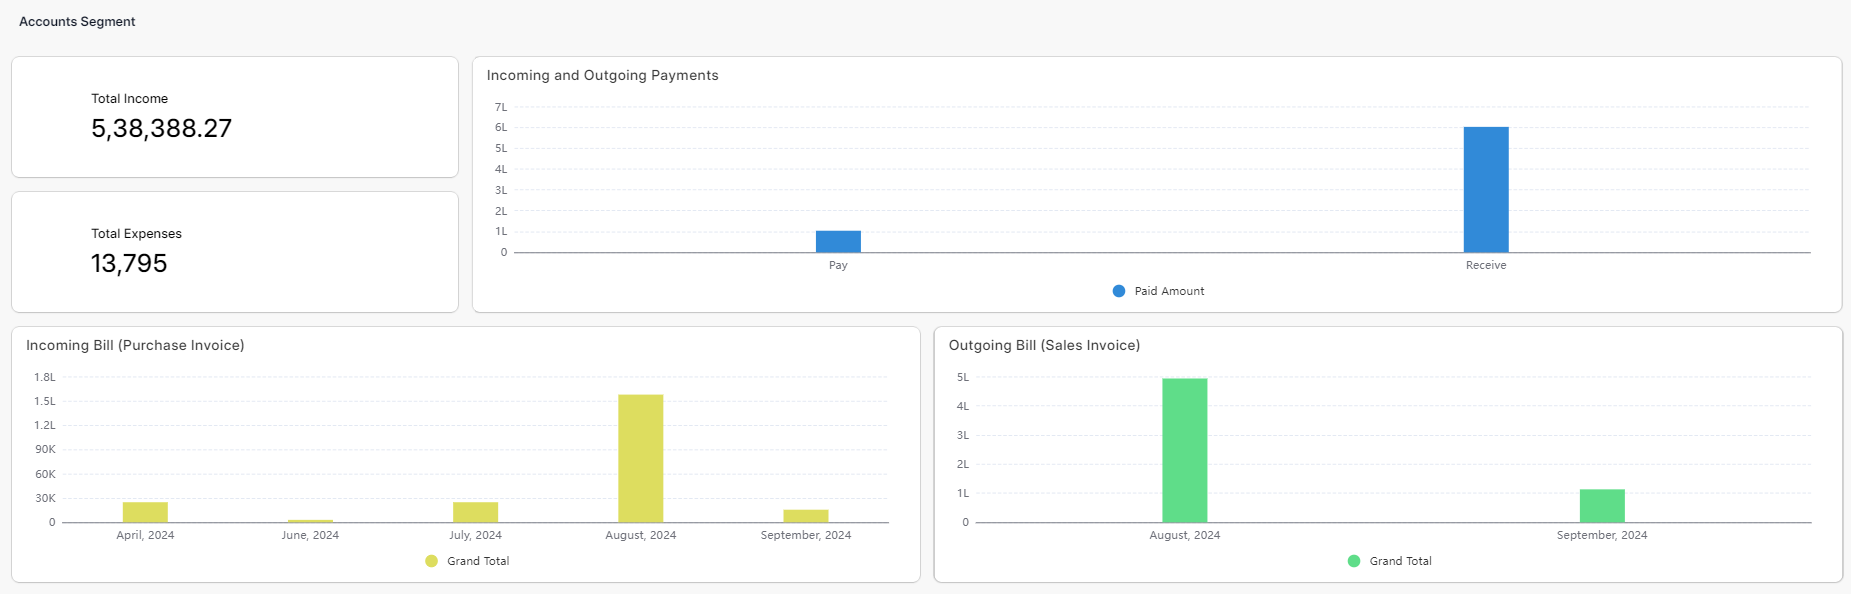
1. Total Income
This metric shows the total revenue generated during the selected time period, providing a clear understanding of the business’s earnings and helping monitor financial growth.
2. Total Expense
This metric displays the total amount of expenses incurred during the selected time period, giving a quick snapshot of the costs associated with business operations and assisting in tracking financial efficiency.
3. Incoming and Outgoing Payments
This section shows a summary of both incoming (customer payments) and outgoing (payments to vendors/suppliers) financial transactions, allowing businesses to manage cash flow effectively. By monitoring both, users can ensure that sufficient funds are available for smooth operations.
4. Incoming Bills (Purchase Invoice)
This section tracks bills from suppliers that are due for payment. It provides insight into outstanding liabilities, helping businesses stay on top of due payments and manage accounts payable efficiently.
5. Outgoing Bills (Sales Invoice)
This section tracks sales invoices issued to customers, showing amounts owed by customers. Monitoring outgoing bills helps businesses manage accounts receivable and ensure timely collection of payments, improving overall cash flow.